How To Use Support And Resistance Lines When Trading Binary Options
 One of the fundamentals of trading binary options involves the use of support and resistance levels. They are plotted on a chart to help determine the direction in which asset prices are likely to head. You can imagine how useful they are when they have been plotted accurately.
A lot of beginning traders – particularly those who are unaccustomed to charting price action – think support and resistance lines are complex. In reality, they are relatively simple. Once you understand them, you’ll have a powerful tool at your disposal for executing profitable binary options trades.
Below, we’ll take a close look at using support and resistance lines to make smart trades. We’ll start with definitions and then work our way toward using this piece of technical analysis to make a consistent profit. It doesn’t matter whether you’re trading binary options for gold, stocks, or currency pairs. Making trading decisions based on support and resistance levels works.
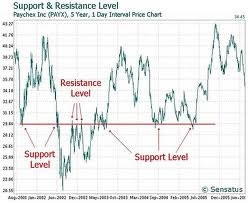
Support And Resistance Lines Explained
A support line is the level below which the price of an asset has been unable to fall during a given period. Every time the price approaches this line, it slows and reverses direction. For example, suppose the price of Google’s stock has bounced between $775 and $810 over the last month. $775 would represent a support line.
A resistance line is the level above which the price of an asset has been unable to climb during a given period. It is essentially the opposite of a support line. Each time the asset’s price rises toward this level, it begins to pull back. In the “Google stock” example above, $810 would represent a resistance level.
The time period over which you should plot support and resistance lines varies by your goal. A lot depends on your trading activity. For example, if you’re simply buying and selling shares of Google, you can get away with tracking the levels from month to month. On the other hand, if you’re trading short-term binary options, you should plot them at 10 to 15-minute intervals. Otherwise, you’ll miss opportunities to execute trades ahead of the price curve (This will become clearer in the following sections.)
Why Support And Resistance Lines Are Important
Traders use support and resistance lines to identify price patterns. These patterns can prove useful in determining the direction prices are likely to move. With such signals, traders can execute calls and puts with a higher level of confidence. In fact, they can get ahead of increasing buying and selling volume to leverage price momentum.
Let’s use our “Google stock” example from earlier to demonstrate how this works…
Recall that shares of Google have (hypothetically) bounced between $775 and $810, forming support and resistance levels at those points. Let’s suppose that over the next 30 minutes, the real-time price falls toward $775.
You know from studying your charts that Google has bounced back from that support level multiple times. It is likely to do so again. You also know that trading volume is likely to increase once the price per share reverses direction and heads upward. By putting in a call binary option for Google near $775, you stand to profit from the move. Additionally, as trading volume increases on the buy side, the price per share will likely gain momentum.
A similar binary options trading strategy can be used with an asset’s resistance level. But instead of executing a call binary option, you would execute a put option. This is done in anticipation of the price reversing and moving downward.
Identifying “True” Support And Resistance Levels
Thus far, we’ve defined support/resistance levels and explained why traders use them. But in order to use them, you need to be able to identify them.
The only way to come up with price levels that offer reliable support or resistance is to chart an asset’s price action. There are a lot of ways to do it. Here’s one way to do it manually…
First, as the asset’s price moves upward, make a note of each high point it reaches before it reverses direction. Second, as the asset’s price moves downward, note each low point it reaches before it reverses direction. Do this in 3-minute intervals over the course of an hour.
Eventually, you’ll begin to see support and resistance levels form. Each time the price hits the high or low level and rebounds from it, the levels grow stronger. This doesn’t mean the price cannot break through. In fact, you can count on it doing so at some point. But the stronger a support/resistance level is, the more likely a “breakout” will signal the formation of a new level rather than mere happenstance.
Be careful to avoid falling for fake support and resistance levels. Prices often bounce up and down within small regions found between the actual high/low points of an asset’s price range. If you wrongly identify these mini-bounces as forming support and resistance levels, you’ll make bad trades with unpredictable results.
Don’t scoff. This problem doesn’t merely trap beginning traders. A lot of experienced traders fall for it, too. Our advice is to learn how to plot and use candlestick charts (learn how here), and treat them with the respect they deserve. If you plot an asset’s price action carefully, there should be no excuse for misidentifying its support and resistance levels.
A Few Last Tips For Using Support And Resistance Levels
As we’ve mentioned in the past, there’s no better teacher than experience when it comes to learning how to trade binary options profitably. There’s a lot of valuable insight to gain by placing trades that is not available in any other way.
Having said that, it’s important to be prepared. Here are a few last tips for getting the most out of support and resistance lines:
#1 – Watch for breakouts. As we noted above, prices can and do cross their support and resistance levels on the way to forming new trendlines. Use the current levels as guides, but realize they will change over time. Think of the changes as opportunities to make a profit.
#2 – When charting the price action for an asset, expect to see at least two price bounces before considering a given high or low to be a resistance or support level (respectively). Preferably, you want to see three bounces, since each one strengthens the signal.
#3 – Asset prices tend to test support and resistance levels without breaking through them. You’ll likely become nervous when this happens. It’s normal. Calm your nerves and learn to trust your charts. When a breakout occurs, it usually does so in the context of forming a new price trend. Your charts should give you a heads-up about that in advance.
#4 – Don’t get lazy with your charts. The more you trade a particular asset, the more you’ll feel as if you know how its price will move. Be warned that binary options have a way of surprising even the most experienced traders. Intuition is important. But tracking price action, keeping accurate charts, and collecting reliable data are much more so.
If any of the above concepts seem complex and confusing, don’t worry. With time, you’ll find that they are actually simple to understand and apply. Most of the complexity is due to a lack of familiarity.
Bonus tip: we recommend setting up a few accounts at reputable binary options brokers that offer free demo accounts. TradeRush, 24Option, and Banc De Binary are great places to start. Get some experience by using the demo accounts to place risk-free trades. Then, jump in with a small bit of your own cash. Don’t be surprised if your binary options expire in the money.
This Youtube.com tutorial explains support and resistance lines with visuals