Price Action: 3 Steps to Trading Successfully
One type of trading that I have written a few articles on here on this site is price action. Price action is attractive to many traders because of its simplicity. It is different from technical analysis and fundamental analysis in that it involves looking specifically at price itself for guidance on what to do next. When you use fundamental analysis, you are trying to gauge what price is doing by understanding events in the economic world. With technical analysis, you are placing technical indicators on your charts that give you some idea of what price may be doing. With price action, you look for formations in the bars themselves. These formations give you information about what the market is doing.
A lot of traders get caught up in recognizing price patterns, and then think that is all there is to it. Even if you are very good at recognizing patterns, though, you may not become profitable if you are not an expert at understanding what those patterns mean and how they fit into events. Here are 3 steps to trading price action successfully. Each of these steps has many steps inside of it, so you should be prepared for a journey of learning if you decide to use price action to trade binary options.
-
Learn to recognize price action patterns.

The Basic Candlestick Chart
This is the most fundamental, basic step to learning how to trade price action; but again, many traders make the mistake of assuming it is the only step. There are many different types of price patterns you can learn to recognize. They have names like head-and-shoulders, triangular consolidation, pinbar, inside bar, and bearish and bullish outside bar. You do not necessarily need to learn how to recognize and trade every single price action formation out there. You may find that some are more reliable than others or more intuitive to you than others. You might only trade one or two price patterns, or you might trade a dozen. It is an individual test you must make through experience and testing.
Open a chart of a currency, commodity, stock or index—whatever it is you think you may be interested in trading. Scroll back in time and spend time looking at the charts and the patterns. Set up your chart to display bars or candles, and make sure you are able to see the open, low, high, and close for each one clearly. Click this link if you do not already know how to read a candlestick or bar chart. You may want to select different colors for bullish and bearish bars so you can see them more clearly. You may have a hard time spotting the patterns at first, but eventually you should start to see them more clearly. You also may notice even while you are learning to look for them that the market often behaves predictably after they appear. Just remember that when you are testing and trading, you will not be able to see the future—only the bars leading up to the bar that is forming or has just finished forming.
-
Location, location, location.
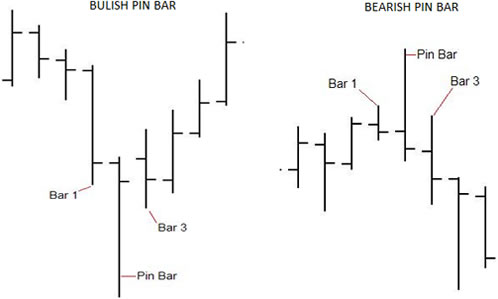
So you have learned to recognize price patterns, and now you are wondering why they fail you so often, despite being nicely formed. The reason often involves location—and the larger picture which is context. Not every price action formation should be played in every location on the charts. For example, a pin bar is a bar with a long protruding high or low, and an open and a close which are fairly close together. This is a bar which opens, tests a high or low, fails to push through, and then is shoved right back down (or up) to where it started.
These bars typically represent reversal patterns—not continuation patterns. This is why a pinbar should be located at a swing high or swing low. If you find one which is not at a swing high or swing low, it is not likely to be as reliable. Likewise, in a sideways or choppy market, a bar like this is likely to get mowed over by more indecision.
Some traders wait to recognize swing highs and lows—they do not identify them until the next bar after the swing has formed, and indicates a reversal in direction. Other traders will look for key areas of support or resistance, also called “pivot zones,” and expect that support or resistance to hold there. Price will often test these levels and turn back around (not always, of course). The price action and the support or resistance line together form confluence—two signals telling you that the same thing is going to happen. You can also use Fibonacci retracement levels to identify possible swing highs and swing lows, since these are other common areas of support and resistance. Location and confluence both play into context, as does learning to identify the difference between a ranging and trending market.
-
Only take the very best set-ups.
Should you take every price pattern that comes along? No—and the reason for that answer is simple. A price pattern by itself is not a trade set-up. A price pattern is more like a confirmation, a sign that it might be time to pull the trigger. The actual set-up involves the market context, and takes into account location and confluence. The shape of the pattern itself also matters. Some patterns are more perfect than others. If you see a price action pattern in a location where it is not likely to work, it does not make sense to trade since you do not really have a setup. If however you see a great pattern in a great location, that can be the perfect time to trade.
While price action is simple in the sense that it does not involve placing a dozen indicators on your charts or paying attention to financial news, it is certainly more complex than it appears at first glance. There really is a lot more to it than simply spotting bars that look a certain way. You have to actually understand the formations and what they signify. You have to be able to place those formations in context, and understand whether they have significance or not, given that context. If you do not understand why something works when it does work, you will not understand why it doesn’t work when it fails you. Charting software may be what you need to get you started. Learn why.
Learning these things takes time and patience, and a lot of practice. Try doing some comprehensive testing with spread sheets. Use historical data first, loading up old charts in a free program like MetaTrader 4. That will give you plenty to work with. Choose a time frame to start working with (if you are having trouble deciding, stick with the 1-day bars or candlesticks to start with). Start looking or patterns, and also start learning to identify ranging and trending markets. Learn how to see when there is a lot of “congestion” in the market and when there is “space,” and which patterns make sense to use in those differing circumstances. Start identifying pivot zones, and then work on putting it all together. Tally up your results, and make sure you achieve excellent statistics before you go live with real money. Good luck trading binary options using price action.