Nadex Charts

Legal US Binary Options
There are so many great reasons to recommend Nadex as a binary options exchange. They are based in the USA, they are regulated by the CFTC, they offer unlimited demo testing, and they give you superior control over your trades. And that is just scraping the surface! Every day it seems like I discover something new about this exchange that knocks my socks off. Most recently, I have discovered Nadex’s charts.
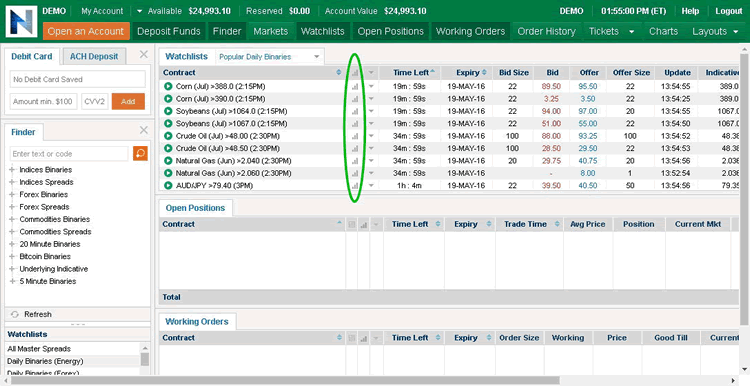
Nadex’s charting software is kind of hard to find. So to make it easy, I have included a screenshot of the trading platform:

Click the little bar graph to access all sorts of trading tools.
Editors note: Get a free demo account at Nadex now and follow along with our tutorials for best results. Visit www.nadex.com and click on the register button on the top right. There is no requirement to invest. Demo trade totally free with registration.
This is what you see when you have the demo version of Nadex open. Looking at this, for a long time I didn’t know there even were charts. Deceptively, if you click on that thing that says “Charts” in the upper right-hand corner, you will get a little dropdown that says “None.” That isn’t very helpful.
So I have circled in green a column of symbols just to the right of the Contracts. Each one looks like a little climbing group of three bars, see?
If you click on one of those for the Contract you are interested in, you will be taken to the applicable chart.
Normally Charts on Binary Sites Don’t Impress
Most binary options websites have charts, but most of them do not offer a whole lot. Your typical binary site has a squashed chart in the middle of the platform which gives you a general idea for what price is doing. Many do not allow you to do more than switch around the way that price is represented (bars, candlesticks, etc.).
A few websites have “advanced” charts which you can expand. Even these are usually quite basic, however. Once again, you can change the view, and maybe even the timeframe. You can usually draw some trend lines if you want to. You may have access to a few indicators, usually only the most basic ones.
Because that is no replacement for a fully functional chart for technical analysis, we usually tell traders to go ahead and download separate charting software (my personal favorite is MetaTrader 4). The idea is for you to plan your trades on MT4, and then execute them on your trading platform.
While this is an extra step, it gives you a chance to use any system you want. Otherwise you would be stuck with whatever indicators (if any) your broker gives you to work with.
What Makes Nadex Charts Different?

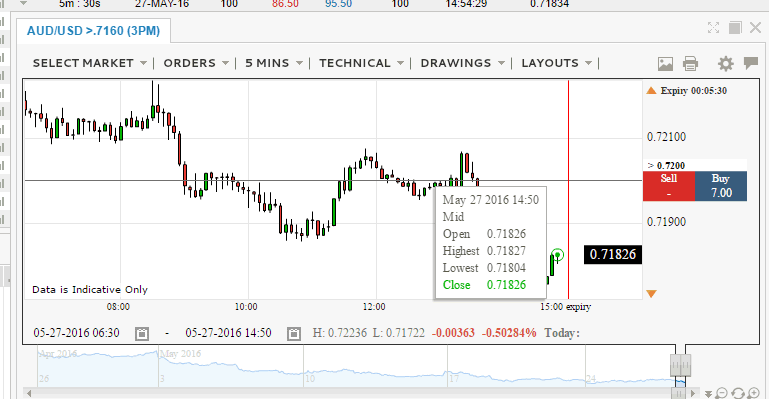
You can zoom in time frames, out, use technical tools, drawings and more.
When I first clicked on the little chart icon on Nadex, my expectations were low.
I was picturing those gimmicky little charts that most binary brokers offer traders.
I couldn’t have been more wrong.
This chart is actually quite professional, and includes a tremendous amount of functionality.
It displays beautifully and you can easily pop it out and expand it to fill your whole screen if you want to. So you have plenty of space to work. From inside the chart you can click on “Select Market” at the top and choose a different asset if you want to view another financial instrument. You can also click on “Orders” to be taken straight to any open positions or working orders you may have.
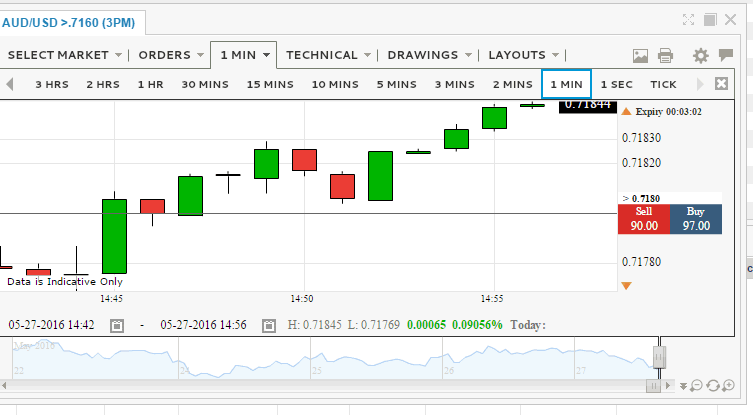
Next to the “Orders” dropdown is a dropdown which lets you choose a timeframe. Next to that are dropdowns for technical indicators, lines, and arrows you can draw, and layout templates.

1 minute candles for short term binaries.
In fact, under “Layouts,” you can actually save and load templates. This is an awesome timesaver, and some additional functionality that a lot of competing platforms lack. That means if there is a particular setup that you need for your trading system, you do not need to go through the hassle of drawing all your lines and indicators every time you sit down to trade. You just do it once, save it as a template, and call on it as needed.
You can easily do price analysis on these charts. The bars display beautifully, are conveniently colored in red and green, and if you hover your mouse over a specific bar, you can see the open, high, low, and close.
Another cool feature I like is down at the very bottom of the chart. At first I mistook that wavy line for an indicator (since some technical indicators display below your main chart). This is actually price history. The grayed-out area is off your screen. If you click and drag on the sliders, you can display different parts of the chart. I have since found this feature on a few other binary platforms as well. It is a delightfully quick and easy way to scroll through price history and adjust your view.

See price history quickly and easily for any time range.
Look At All Those Technical Indicators!

More options for technical analysis than any other broker we use.
The most exciting aspect of the Nadex charts is what you get if you click on the “Technical” dropdown at the top. As I mentioned before, on most charting platforms on binary websites, at best you can expect a handful of technical indicators.
Nadex pulls up a ton of different indicators. And you will notice that at the right-hand side of your screen there is a little arrow after the last indicator displayed. Click on that and you can bring up even more indicators. There are 22 in all. I don’t see anything labeled “Custom,” so unfortunately I do not think you can import your own. But this is a huge selection.
Another cool thing about this platform is that it displays little icons above all the different technical indicators on the menu. These icons are excellent for beginners, as they give you some idea what each of these indicators look like when they display on your chart. Whether you are totally new to technical analysis or you simply keep forgetting which indicators are which, these icons will help you to find what you need quickly and easily.
If you are new to technical analysis, it is well worth going over each of these technical indicators in detail. This will be the subject of an upcoming article, A Field Guide to Technical Indicators in Nadex (article will be posted soon and linked).
More Nadex Content
Editors note: Get a free demo account at Nadex now and follow along with our tutorials for best results. Visit www.nadex.com and click on the register button on the top right. There is no requirement to invest. Demo trade totally free with registration.