Divergence and MACD
If you’re new to binary options, you also may be new to technical analysis, unless you have already done some trading before in Forex, stocks, or some other asset. One of the tools in your trading toolbox as a technical trader is called MACD, which stands for Moving Average Convergence Divergence. As you might guess, MACD can be used for divergence trading. How do you use MACD and divergence trading to win more binary options trades? What follows is a technical trading article. If you have not yet familiarized yourself with the basics of trading binary options, I suggest you do that first. This beginners page is an excellent starting point.
What is MACD?
The Moving Average Convergence Divergence tool is used to identify moving averages which may be indicative of a new upward or downward trend. While you can make money in a ranging market, it is generally easier to be profitable when you are trading in a trending market. And if you can catch a trend as it is forming, that is the best time to get in on the action. The more of the move you can catch, the better. Many binary options brokers provide tools to traders such as rollover which help you to take advantage of large moves up or down. With the MACD, it is easier to determine which way price is going and get in on the bet going in the right direction.
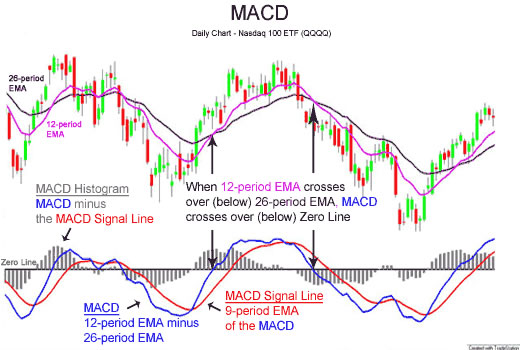
When you go to place an MACD on your chart (you do have charting software, right?), you will generally see three numbers used to control the settings for the indicator. The first of these numbers indicates how many periods will be used to calculate the faster of the two moving averages. The second number indicates the number of periods which will be used to calculate the slower moving average. The third number is the number of bars which will be used to calculate the moving average of the difference between the two.
When the MACD is calculated, you will see it under your main chart. You will notice two moving averages and a bar chart. This is a bit confusing for many traders, but it is useful to know that those two moving averages you see displayed on the indicator are not moving averages of the price. They are actually the moving averages of the difference between the two moving averages that you input when you selected your numbers—or rather, the first one is. The second one is a moving average of that moving average (the slower one).
The bars below that comprise the histogram, which displays a plot of the difference between the two moving averages displayed by the MACD. When the moving averages converge together, you will notice the histogram getting smaller. When the moving averages diverge from one another, the histogram gets bigger. This is why the MACD is called “Moving Average Convergence Divergence.”
MACD is actually part of a larger category of indicators called oscillators. Other oscillators include the stochastic, RSI and CCI—and there are a lot more besides those. You will find a number of different oscillators included in your trading software if you have a nice charting program like MetaTrader 4.
Divergence Trading
MACD can also be used for divergence trading. This doesn’t actually refer to the “Divergence” which is part of the name MACD. Rather, it refers to the divergence between the MACD histogram and price as it appears on your chart. You do not have to use MACD to do divergence trading. You can choose any oscillator you want, but now that you understand MACD, that gives you a good starting point for learning divergence trading.
Plot the MACD on your chart when you believe you are reaching a swing high or swing low—a place where the market may be ready to reverse and begin a new, opposing trend. Draw a trendline across the highs of your candles if the current trend is up, and across the lows of your candles if the current trend is down. Then look at your oscillator histogram, and its highs and lows. Do the same thing with the histogram. Select the trendline tool, and draw a line across the highs or lows, just as you did above.
Do your trendlines go in the same direction (both upward or downward), or do they go in opposite directions?
Bullish divergence will have a pattern of lower lows (a downtrending line) in your main chart, and a pattern of higher lows (an uptrending line) in your MACD histogram.
Bearish divergence will have a pattern of higher highs (an uptrending line) in your main chart, and a pattern of lower highs (a downtrending line) in your MACD histogram.
How Does This Help You?
With bullish and bearish divergence, you can spot possible trend formations (at reversal points). This tells you that price is likely moving up or down, and if you have additional confirmations, that is even better. The stronger your setup, the more reliable your trade is likely to be. When you trade binary options, you have to pick a direction—up or down—that you believe price is moving in. This is what tells you the “up” or “down.” New trends are often strong and can deliver up a lot of profit if you get in them early. If your broker offers you rollover, you can stay in your trade past the initial expiry time and make even more money. In consolidating markets, it is not only harder to spot a good trade to begin with, but you usually cannot stay in them for long before the market reverses on you. Make sure you test this or any other method you learn before you put it to use with real money!
Another way to help spot good trades is to watch for trends. Find out how here.
Before you start on this intermediate level of binary options and begin to feel overwhelmed do your research! Find out as much as you can at places like: