Identifying Swing High Lows
There are a lot of different reasons you might want to learn to identify swing highs and swing lows when you are trading binary options. What is a swing high or swing low? Swing highs and swing lows are points of trend reversal—though there may be a fair amount of consolidation during that reversal period.

Try opening up a chart of a currency, commodity, stock, or index, and looking at the movements of the price bars as price goes up and down. Notice how sometimes price will “peak,” and then reverse direction? And likewise, how price will sometimes reach a trough, and then reverse and go up again?
Reversals may be sudden or gradual. How do you identify these important areas to assist you with your trading? This is an advanced technical article, where I am going to teach you about a number of different trading tools, and how to bring them together for success. If you are brand new to binary options, I recommend you first check out some of our articles on basics (start with this list ), and then return to this topic when you are ready to give yourself an edge.
One thing you can start by doing is looking at charts and searching for peaks and troughs that “jump out” at you. After you get a basic feel for what constitutes a swing high and a swing low, you have some idea of what to look for when you look at the recent past or current price data.
Identifying recent swing highs and swing lows is much easier than figuring out whether you are in a swing high or swing low at present. You can use recent swing highs and lows to draw Fibonacci retracement levels and conduct other analysis of price. Remember that the most recent data generally has the most bearing on what is happening right now—but past data may also be relevant. Sometimes you can overlay multiple retracement levels using multiple sets of swing highs and lows and find confluence between the levels. Those levels are often particularly strong and provide extra support or resistance.
What about determining whether a swing high or swing low is forming right now? That is a bit trickier, because what looks like a change could simply be another retracement, part of a larger pattern of continuation. Ultimately there is no way to be certain you are at a swing point or not, because if it were possible to know that for sure, then everyone would easily be able to profit off of identifying swing highs and lows as they were forming.
Check for Confluence
What you may be able to profit from however is determining whether it is likely that a swing high or low is forming, because this generally signals a reversal in the trend. To figure out whether you may be in a swing high or low, you have to look for clues. One common tactic is to zoom out to a higher timeframe and check there. So for example, let’s say you are following an asset on the daily timeframe, with each bar representing the passage of one day. Price appears to be hovering at a certain level, and looks like it may be reversing soon. Zoom out to the weekly timeframe and see if a previous swing high occurred at that price level. If it did, it is a good indication you are up against strong resistance, and you are now in the middle of a swing high on the daily timeframe as well.
Of course, it is also possible price will keep right on going, or that it will retrace briefly downward before continuing on its upward climb. That is why you need to search for other confirmations as well. Are there other forms of resistance which could be providing confluence? Is there a prize pivot zone in that area? What about a Fibonacci level? (How do you draw a Fibonacci level?) How about a round number (in price)? Perhaps a moving average (one or more)? All of these are areas of potential support or resistance. The more of them you see in one place, the harder it will be for price to break through that level and continue on. If you notice moving averages flattening out, that may also mean you are exiting a trend and entering a consolidating period.
Divergence Trading
Another indication of a possible reversal is divergence. To use divergence, you place MACD or another oscillator of your choice on your chart. The oscillator will display as a separate graph below your existing one. Divergence trading is so named because you are looking for a divergence in the direction of price and the oscillator. Let’s say for example that you are in an uptrending market, but you believe that you may now be reaching a swing high, and price may be reversing. If you see price making higher highs but your oscillator is making lower highs, that indicates divergence.
If you are having a hard time seeing clearly, draw trendlines on both your main chart and on the oscillator. Connect the highs on your main chart, and then connect the highs on the oscillator below. If the line on top is pointing upward and the line on the bottom on the oscillator chart is pointing downward, there is a divergence between them. If they are both pointing upward or downward, there is no divergence.
If you see divergence forming, it often signals a trend reversal. This is a great tool for adding even more evidence to a possible price reversal.
Price Action
Yet another way you can confirm that price may be changing direction is to look for patterns in the bars themselves which are indicative of a change. Certain price patterns are most reliable when they are found in trend reversal areas. But remember, by themselves, they may not indicate anything. They may simply be well formed bars in bad locations. That’s why you need to look at all of the context discussed above before you jump on a trade—even if price patterns are going to be your sign to pull the trigger.
Here are some price patterns to be alert for at possible trend reversals:
Pinbars.
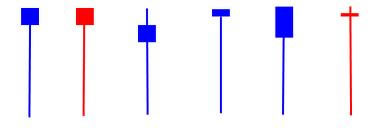 These are bars that have a long, protruding “nose” which stick way out above or below the open and close. The open and close will preferably be as close together as possible on a well formed bar, and will be in the last 3rd-4th of a bar—the closer to the end of the bar, the better. When you see the open and close in the middle, what you have is a neutral bar, and that is different.
Pinbars often signal reversals in the direction of price. The protruding “nose” is lying to you—it points in the opposite direction of the reversal. So if you are at a swing high, you might see a pinbar which points up with the long nose. The open and close are very close together in the bottom quarter of the bar. What this means is that the market tested going higher and was forced right back down. That often means that you are at a reversal point, and a downtrend is about to form. Sometimes there is some consolidation before that happens.
Bullish and Bearish Outside Bars
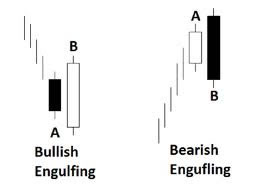 These are bars which have bodies that fully encompass the bars just proceeding them. Bullish bars have a low open and a high close, and bearish bars have a high open and a low close. You look for these bars at possible reversal points as well. Bullish outside bars work best if you find them at a swing lows, and bearish outside bars work best if you locate them at swing highs. These bars (and pinbars) can also signal continuations, but they are harder to play that way.
Patterns with Multiple Bars
Sometimes at trend reversals you will come across multiple bar patterns. One great example is a double bar high with a lower close. When you see this formation, you will generally find it most useful around a swing high. Both the bar highs will be either identical or close, and the close of the second bar will be below the low of the previous bar. At swing lows, you will sometimes find the opposite—a double bar low with a higher close. You may also see variations on this type of formation where you have a triple bar high or low.
Price action is a great method for trading, either by itself or combined with technical analysis. If you like to keep things simple, you might find this method particularly appealing. Read more about price action trading on this post.
Bringing It All Together
Identifying swing highs and swing lows is a challenging skill, but when you learn how to do it effectively, what you are essentially doing is determining what price is doing based on what you see. And that is the key to becoming profitable with binary options: understanding price and correctly ascertaining why it is behaving the way it is and what it is likely to do next. So once you bring all these different tools together—confluence, divergence, and price action—you are on your way to not only spotting swing highs and swing lows, but also winning more binary options trades.
When you trade binary options, always look for the very best setups. You will find a lot more setups to potentially trade than you should actually act on. With so-so setups, you will get so-so results. With excellent setups, you will have the chance to achieve excellent results and build a profitable binary options trading account. These are just a few techniques you can use to trade. Experiment with different approaches and discover what works best for you!