What is an Oscillator?
The most successful binary options traders are those who use a trading system of one sort or another. Many trading systems have their basis in technical analysis. Learn your own trading system here. Technical analysis systems involve placing various indicators on your trading charts and analyzing those indicators for patterns which may indicate that price is heading a certain direction (or heading nowhere). One type of technical indicator which you may find useful in trading binary options is called an “oscillator.” Oscillators are actually a whole category of indicators, and you will find many different types of oscillators which you can use in your trading.
Leading vs. Lagging Indicators
In technical analysis, indicators are lumped under two broad categories respectively called leading and lagging indicators. Leading indicators anticipate market movement based on the information which is already available. They give you a signal to trade before a new trend forms or the existing trend reverses direction. Lagging indicators on the other hand do not anticipate. They tell you about a new trend after the trend has already started forming.
Oscillators are leading indicators. The word “oscillate” means to move up and down, or back and forth. You can, for example, oscillate between decisions before you make up your mind, in a non-literal sense. In a literal sense, something that oscillates literally moves between two points. An oscillator, as an indicator, does this on your chart. When you add an oscillating indicator, you will see it displayed at the bottom of your chart, as a separate graph which moves along as price moves along above. The movement of the oscillator line “oscillates” back and forth, telling you something about what price is doing.
Here are a couple of examples of oscillators you can use to trade binary options:
Stochastic.
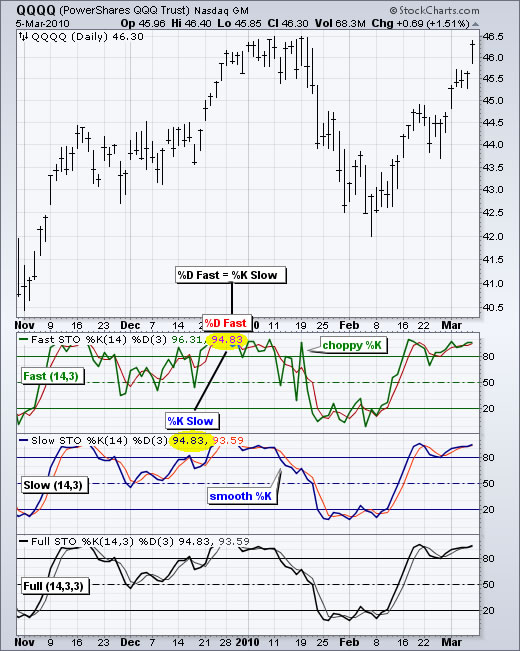
When you plot the stochastic, you will find it on the bottom of your chart. The lines measure how overbought or oversold the market is, and move along a scale that measures 0 to 100. There are two lines, one of which is faster than the other. The two horizontal lines you see the lines ranging between (and sometimes above and below) are 20 and 80. When you see the lines cross above 80, the market is considered to be “overbought.” Below 20, it is considered to be “oversold.”
As you might expect, the stochastic oscillator helps you to spot trend reversals. When you see the lines below 20, that is generally when you can expect an upward reversal, so you would buy. When the lines are above 80, you can expect a downward reversal, so you would sell. These are just general guidelines. How you use the stochastic or any other oscillator will depend on the specifics of your system.
Relative Strength Index (RSI)
The RSI is very similar to the stochastic oscillator. When you plot it on your chart, you will see a similar looking display with a line oscillating between (or above or below) two horizontal lines. The scale once again reads from 0 to 100, but the lines are placed at 30 and 70. Once again, this is an oscillator which focuses on finding trend reversals. When the line goes below 30, you would buy, and when the line goes above 70, you would sell. Sometimes traders also look at 50, in the middle of the oscillator, and see whether price is above or below it to confirm an existing trend.
Average Directional Index (ADX)
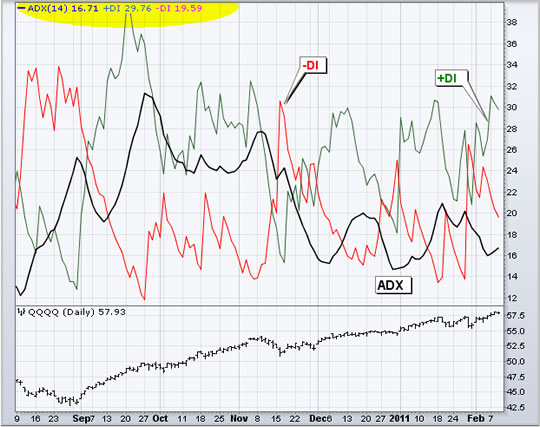
ADX is an oscillator that displays at the bottom of your chart like the stochastic or RSI. The ADX scale ranges from 0 to 100, but it works differently. This is a measurement of the strength of a trend, not its direction. When the ADX dips below 20, a trend is considered rather weak (or even ranging and not really trending at all). When the ADX rises above 50, this is an indication that you are looking at a strong trend, whether it is bullish or bearish. The ADX is most useful when you combine it with another indicator that can help you spot direction. Then again, if you are doing Boundary trading or No Touch trading, the ADX alone giving a “weak trend” readout might be sufficient for you to spot a trade.
Moving Average Convergence Divergence (MACD)
With the MACD, you will observe two moving averages as well as a bar chart. This type of oscillator shows trend reversals. When you draw trendlines across the highs or lows of the histogram in the MACD and see the trend lines diverging (going in the opposite direction) from the trend lines you draw across the highs and lows of candles on your chart, you may be looking at a trend reversal and a trading opportunity. This is quite a complicated topic, which is why I wrote a whole article on it here. MACD is not that tricky of a concept once you learn about it, but it does take a bit of space to discuss in depth. There are also different types of divergence trading which you can learn based on the MACD.
Dangers of Oscillators
As leading indicators, oscillators give you the advantage of getting in on a trend right from the beginning, which can help you maximize your profit. The drawback though is that these indicators may be less reliable than lagging indicators and give you a lot of false breakouts. Fortunately, this is something you can deal with if you add some more indicators or use trend lines to provide some confluence. If your oscillator says there is going to be a breakout or reversal and you have another signal confirming it, that may be a great setup for a trade.
The oscillators I have just discussed are not the only oscillators out there, and you can choose a lot of options for setting up some of them (like the MACD). Many people use customized oscillators. Try experimenting with different oscillators. Set them up and scroll through your charts, looking for indications of breakouts. See how accurate each of them is on different types of financial instruments, and look for ways to combine oscillators with other indicators or price action or fundamental analysis. Test your system thoroughly before you trade with real money.